As the Federal Reserve looks to employment data for tapering guidance, it’s becoming more evident that the Delta variant may throw a wrench into the monetary debate.
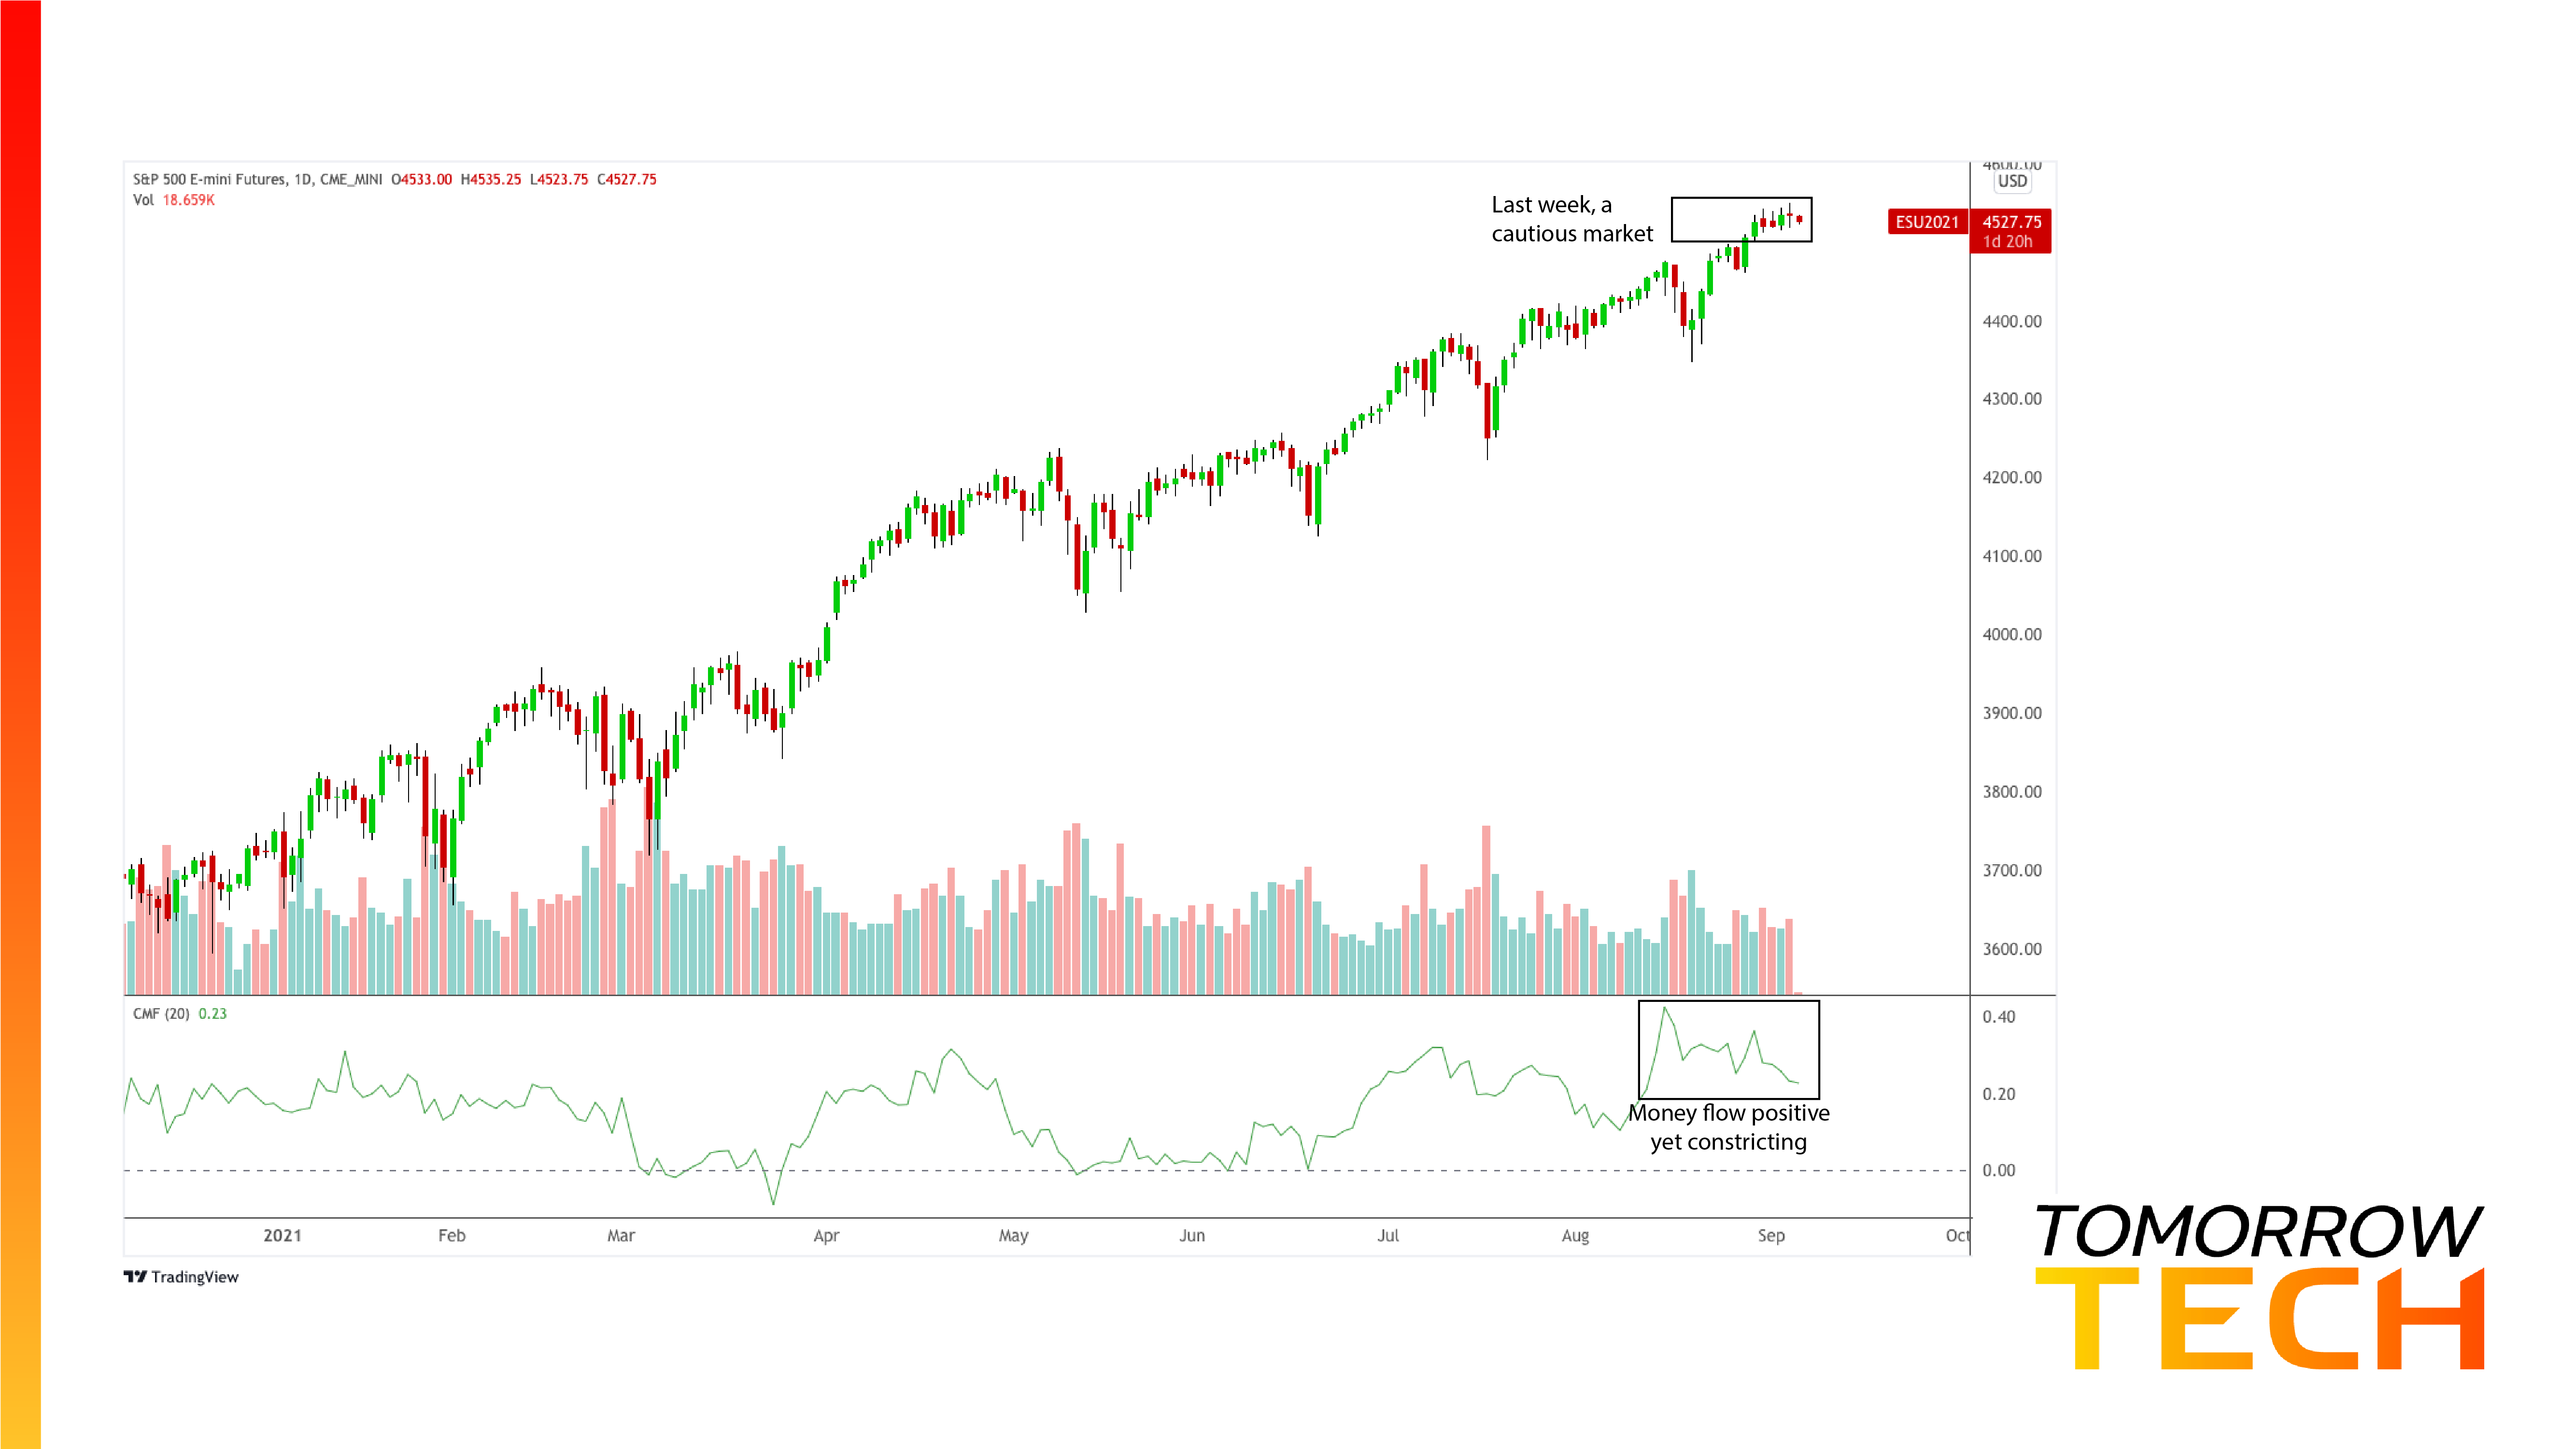
Remember that sensation you get when riding a rollercoaster that’s about to go into its first drop, the one that gives you that unsettling feeling in the gut? You creep up slowly, taking in the acrophobia-inducing view before submitting to the inevitable three seconds of a heart-stopping plunge. That’s how the S&P 500 might have felt this last week for many investors.
But markets aren’t subject to the laws of physics. And “divine intervention” by central banks has a way of altering the nature of economic reality.
Markets across the globe held their collective breath a few weeks ago in anticipation for some “big reveal” in Federal Reserve chair Jerome Powell’s opening speech at the Jackson Hole conference. The world got its answer, and tapering is on the table. But the timing and amount of tapering remained vague.
This past week, the markets were at it again, blue in the face waiting for the big US jobs report, aka Employment Situation, for clues as to how the Fed might initiate its taper. Remember that the Fed told investors that it was watching employment data very closely, as it may guide its approach to pulling back on monetary stimulus.
As it turns out, job gains of 235,000 in August were well below analyst estimates of 750,000. This puts into question the pace of economic growth as the US struggles with Covid’s new Delta variant.
A significant factor in these numbers was zero growth in the Leisure and Hospitality sector, which for many months have shown huge gains. Restaurants and bars took a halt in hiring. US government jobs also dipped by 28,000 in August. In short, Delta is the emerging story—and a potentially global one at that. Somehow, this comes with a bit of a surprise.
So, what’s to happen with monetary stimulus? Once again, it depends on the variant and its effect on domestic and global economies. For now, markets appear to be betting on a more “dovish” approach to a “hawkish” taper. Yet, markets revealed a sense of caution, unsure whether the next plateau may lead to a dive or further upside, however unnatural that might seem considering economic “reality.”
Economic News Watch
This week is going to be a bit sleepy on the economic data front, and it follows what turned out to be an uneventful week. The big RBA interest rate decision happens this Tuesday. However, it appears that analysts are expecting no change from the previous period. Still, it’s potentially market-moving should any indications deviate from consensus.
The US JOLTS report takes place Wednesday; often a market-moving release, the current “worker shortage” may tame whatever insights this report may bring forth.
The ECB rate decision gets released later in the week, something to pay close attention to.
And finally, the US PPI will hopefully give us some insight into the inflationary situation that appears to be heating up to record levels.
Money Flow’s Clue on Renewable Energy Market Sentiment
The iShares Global Clean Energy Index Fund ETF (ICLN) represents wind, solar, and electric companies worldwide. It’s one of the most considerable renewable energy ETFs in the marketplace. While legacy energy commodities have either recently climbed or showed resilience, the technical scenario for the renewable energy sector paints an interesting picture.
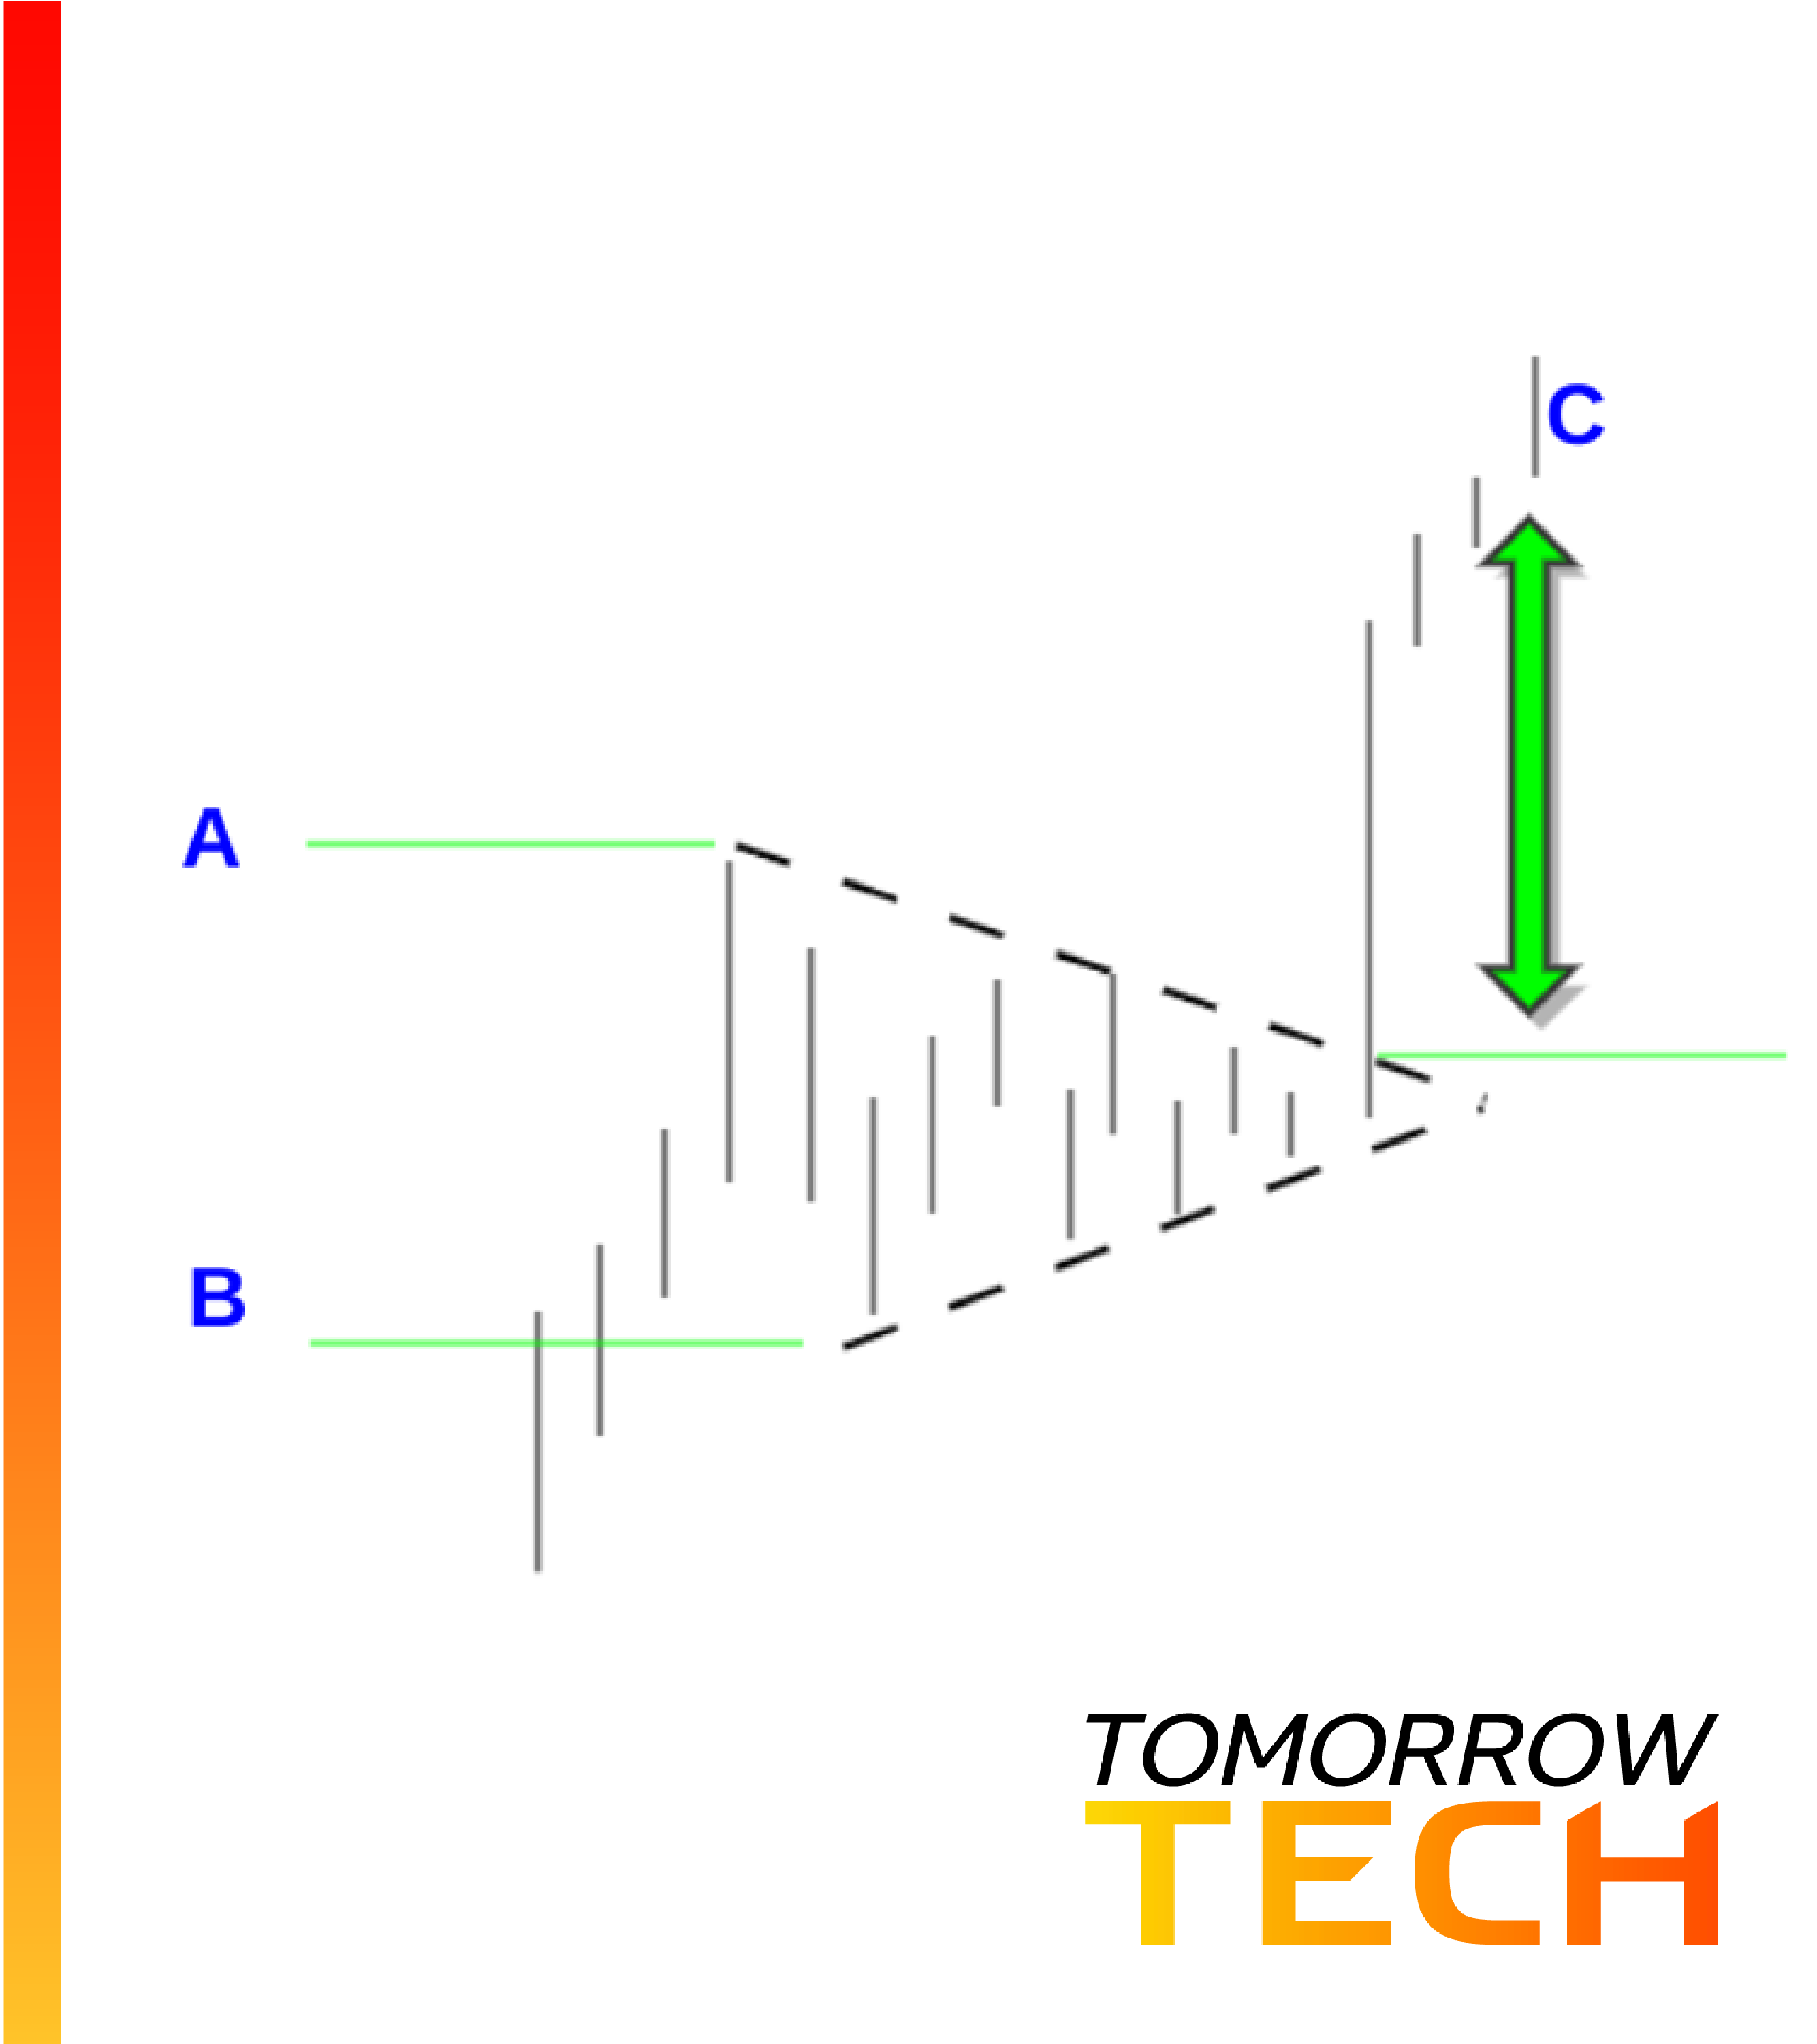
Here’s a traditional way of forecasting the trajectory of a symmetrical triangle breakout. You simply subtract the top of the formation [A] from the bottom [B] and add the difference to the breakout level, which gives us the price projection near [C] in theory.
Although chart patterns can provide clarity in expectation, it’s essential to pay attention to other technical factors, especially volume.
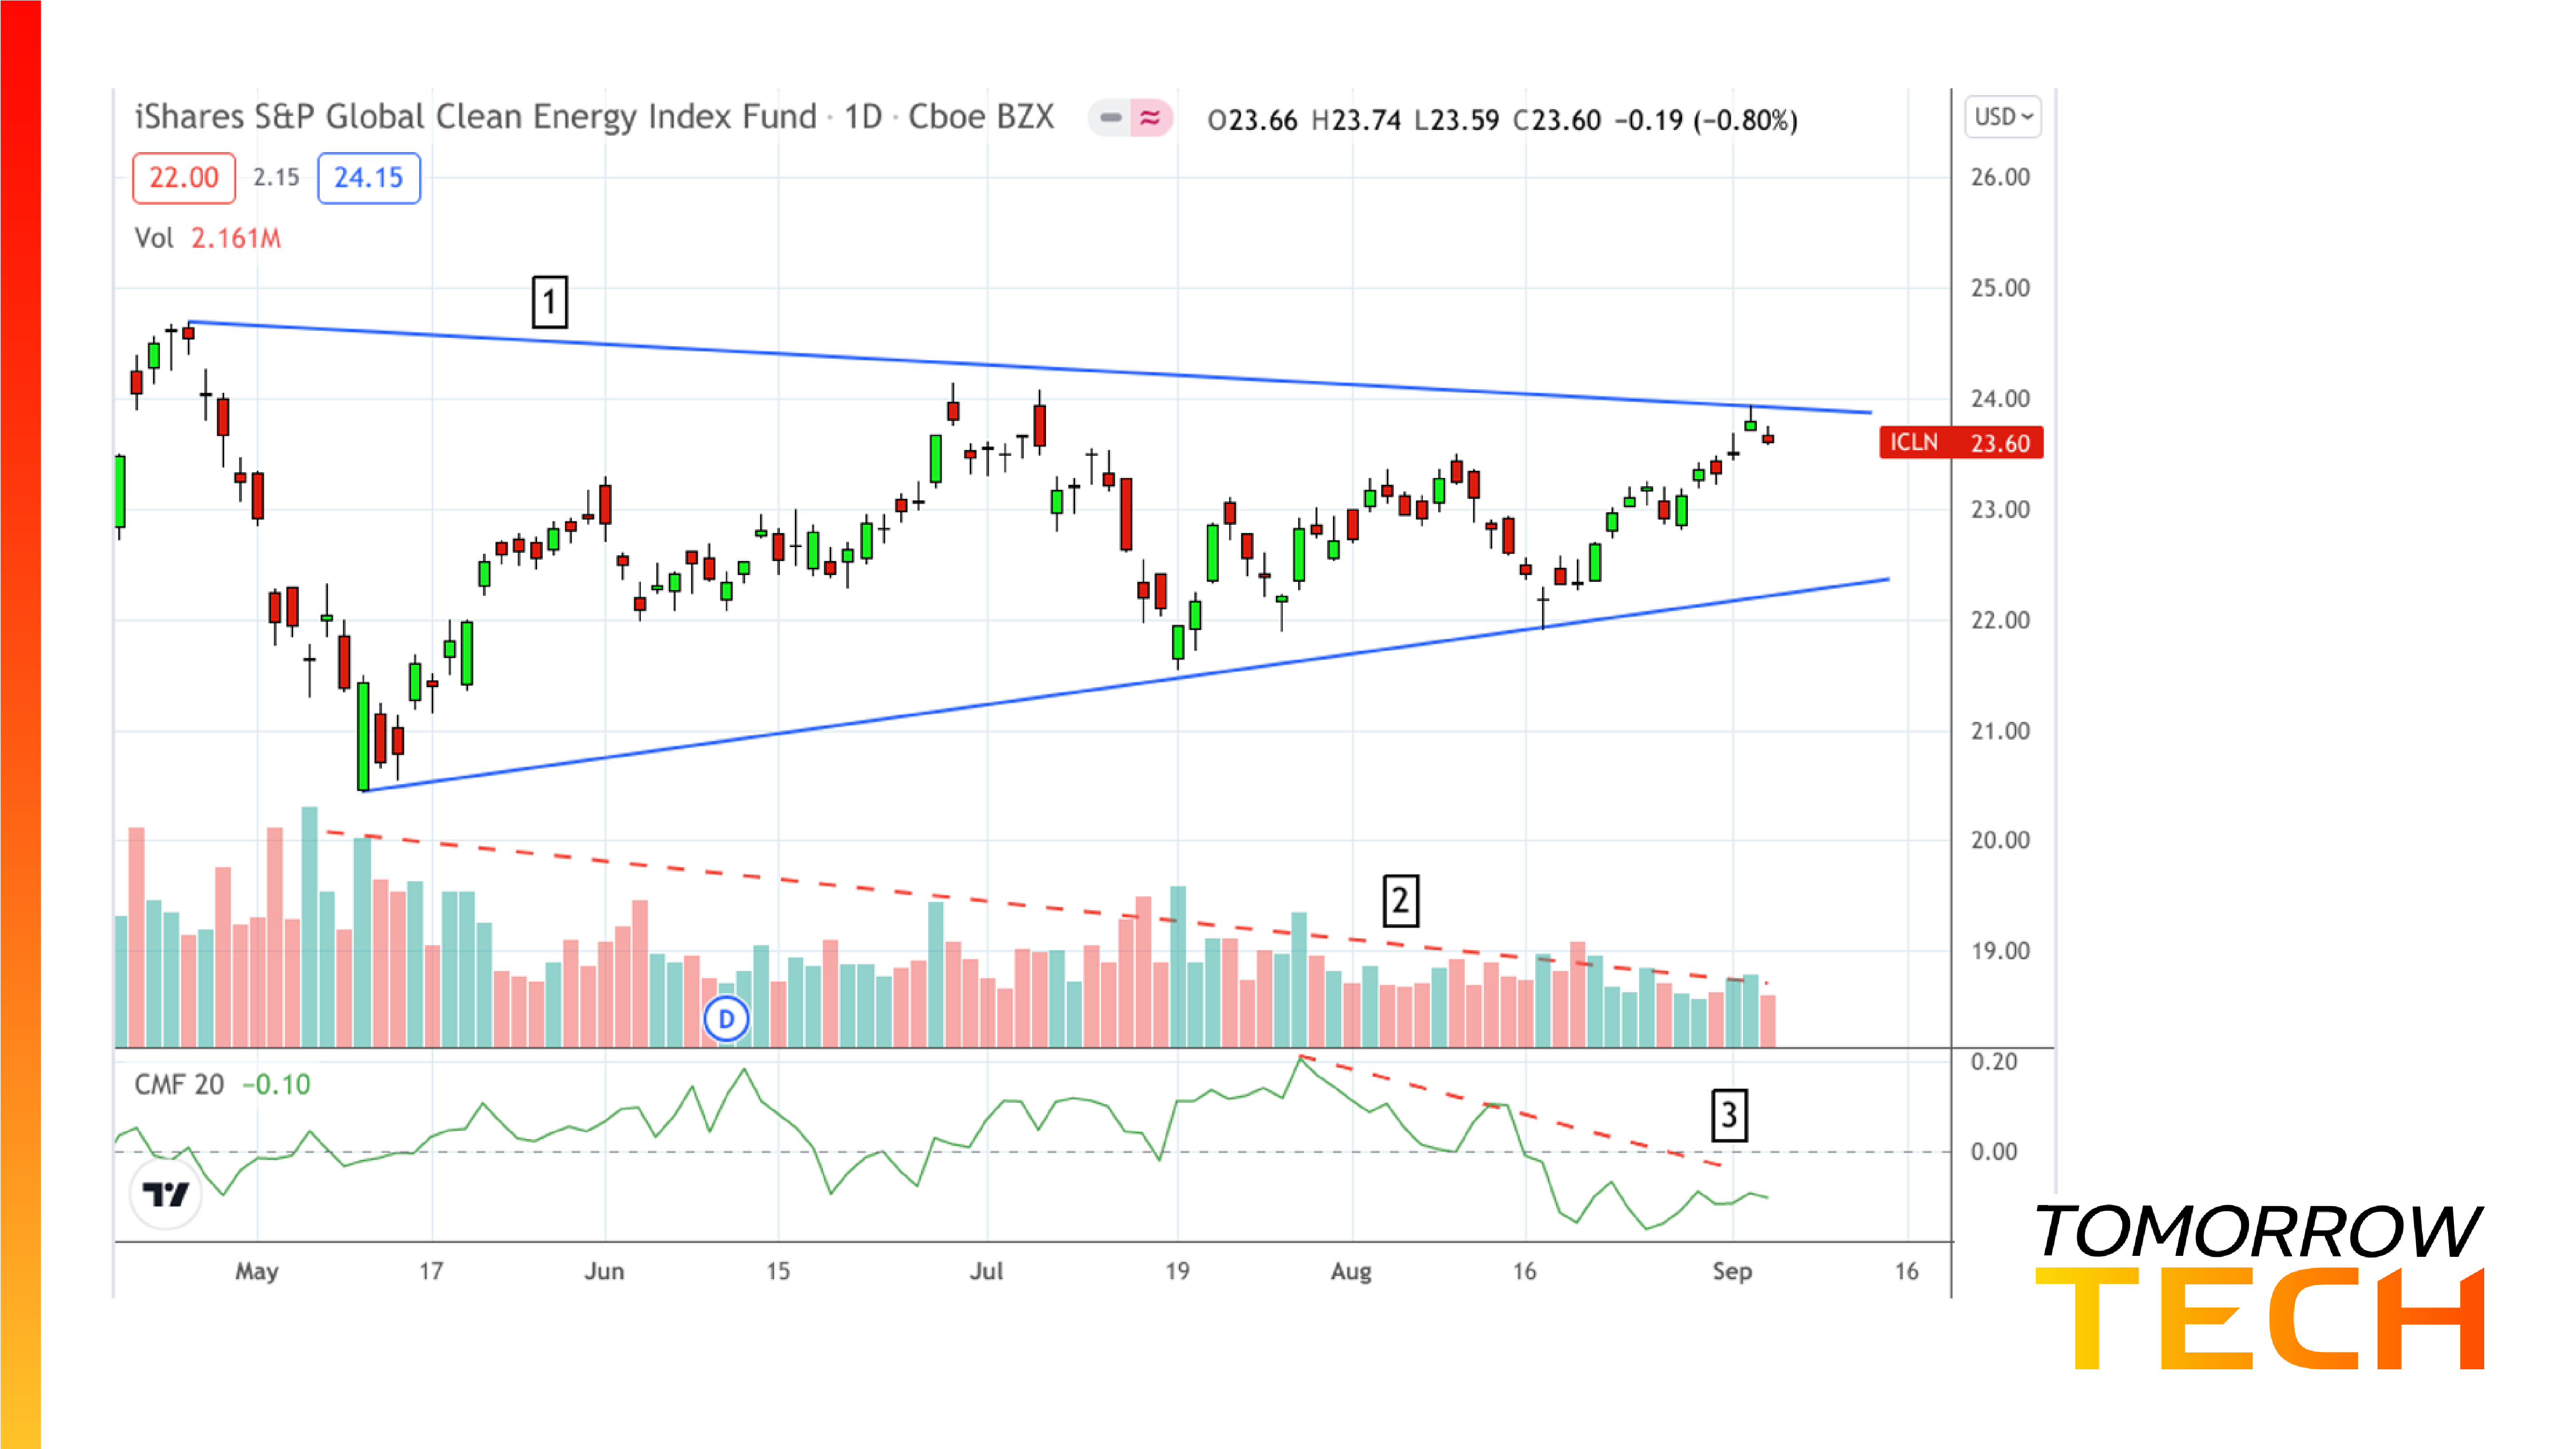
As a proxy for the global renewable energy sector, ICLN is exhibiting what appears to be a long four-month symmetrical triangle [1]. Symmetrical triangles have a 50% chance of breaking toward the upside or downside. However, volume and money flow can also indicate the sector’s likely “technical” trajectory, however short that movement may be. Volume is dwindling [2]. The Chaikin Money Flow Index is also showing a severe divergence [3]. When asset prices rise as money flow declines below the zero midrange, this combination is typically interpreted as bearish.
So, suppose you’re watching this sector closely. In that case, you might want to weigh this technical indication against your fundamental assessment to better plan your market strategy.