Jack Dorsey tweeted hyperinflation jitters as mainstream investors are thinking twice about drinking the “transitory” kool-aid.
Corporate earnings dominated this week, and they will continue to do so in the weeks ahead. The good news is that over 80% of all US companies reporting thus far have hit the ball out of the park with positive.
EPS surprises, according to FactSet metrics.
But suppose you read the earnings call transcripts. In that case, many execs are worried about looming supply problems, labour shortages, and rising commodity costs—in short, inflation.
Twitter and Square CEO Jack Dorsey went off the far end with it.
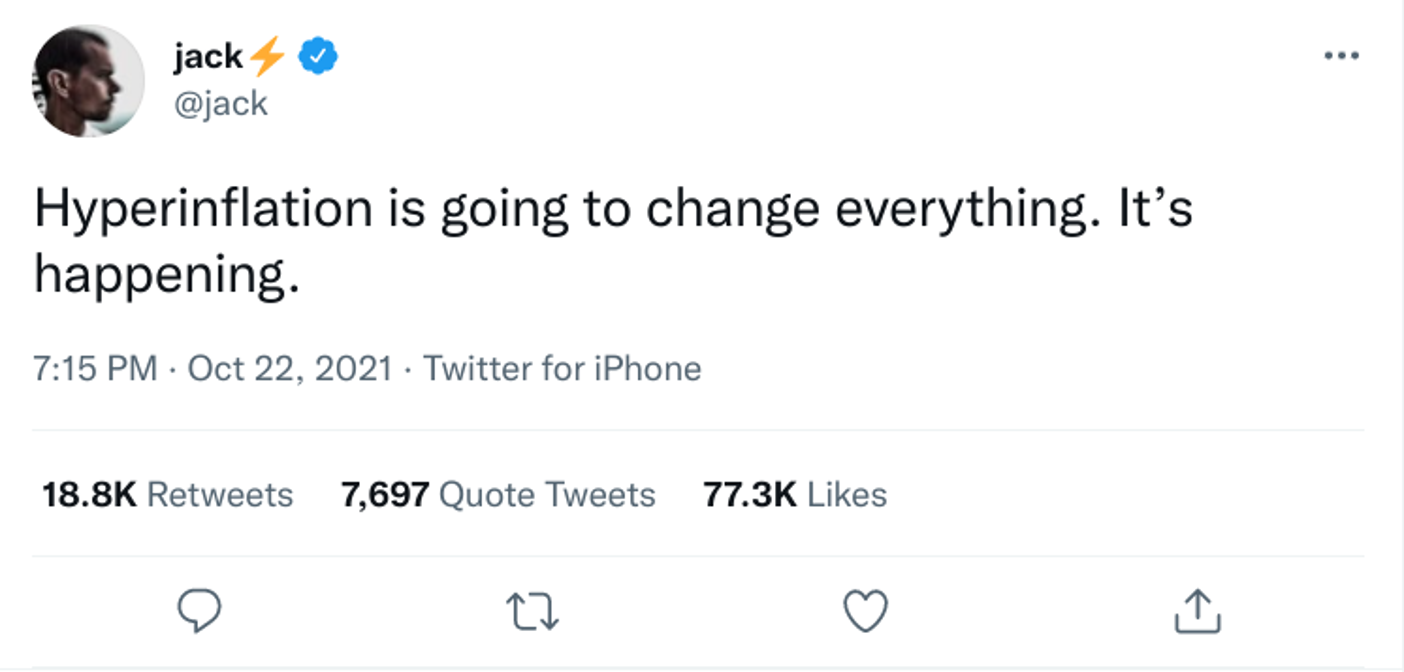
Dorsey also tweeted in response, “It will happen in the US soon, and so the world.”
More than a week ago, Fed chief Jay Powell admitted that inflation would run hotter and longer than initially expected. Arguably, we may be seeing “stagflation” in the US, but is hyperinflation a possibility?
The mainstream seems to have dismissed Dorsey’s warning. But again, they also bought into the transitory narrative.
Many economic “experts” like the US Treasury’s Yellen see the CPI normalizing in 2022. The Fed seemed to think so as well…until they didn’t.
The same can be said about the ECB. Now, inflation in Europe is scorching hot.
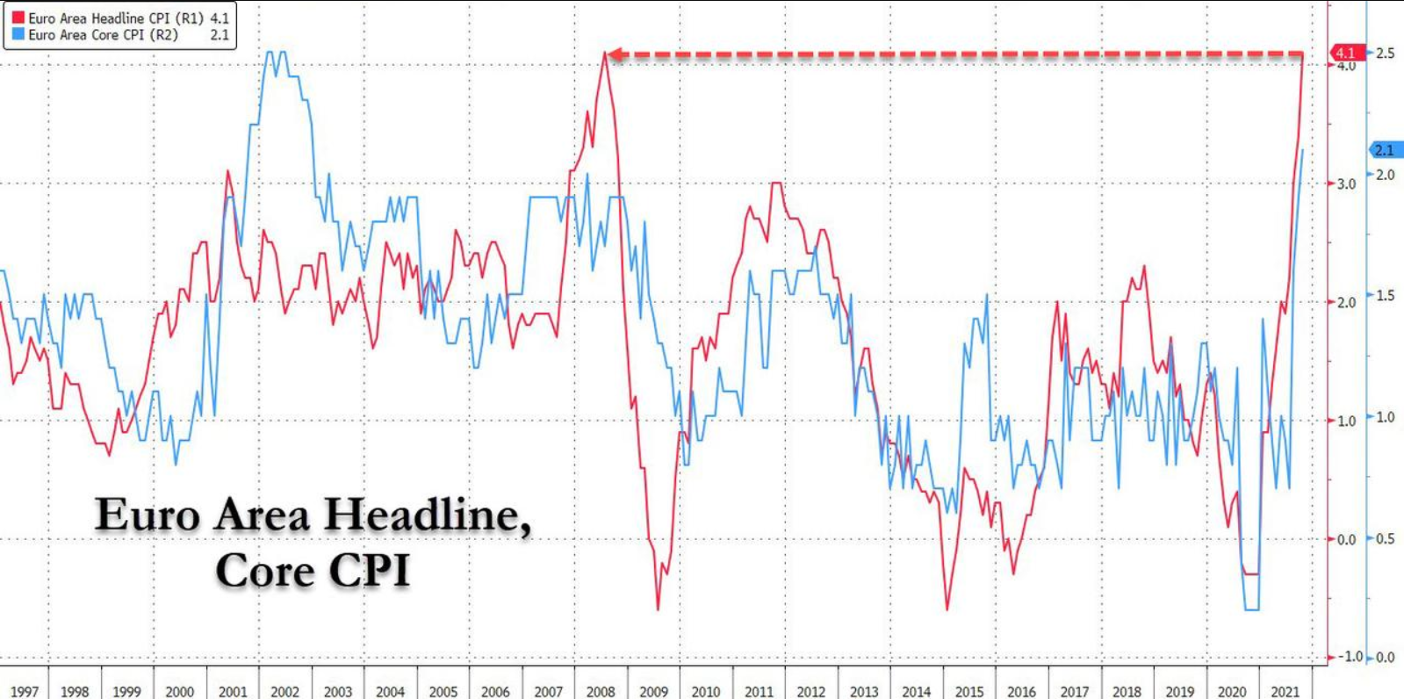
Not to mention, the ECB was taken by surprise.
So, what’s to back the “transitory” theory if its very sources (central banks) find themselves befuddled?
Economic News Watch
Three weighty themes for this week: earnings, inflation measures, and employment data.
Facebook’s Pullback Conceals a Few Critical Levels
Facebook’s most recent scandal did more than take its shares down; it prompted the social media giant to ditch its own name (now called “Meta”). While earnings helped boost shares, lower revenues due to slowing ad sales amid Apple’s new privacy restrictions brought it down again. So, what’s the play?
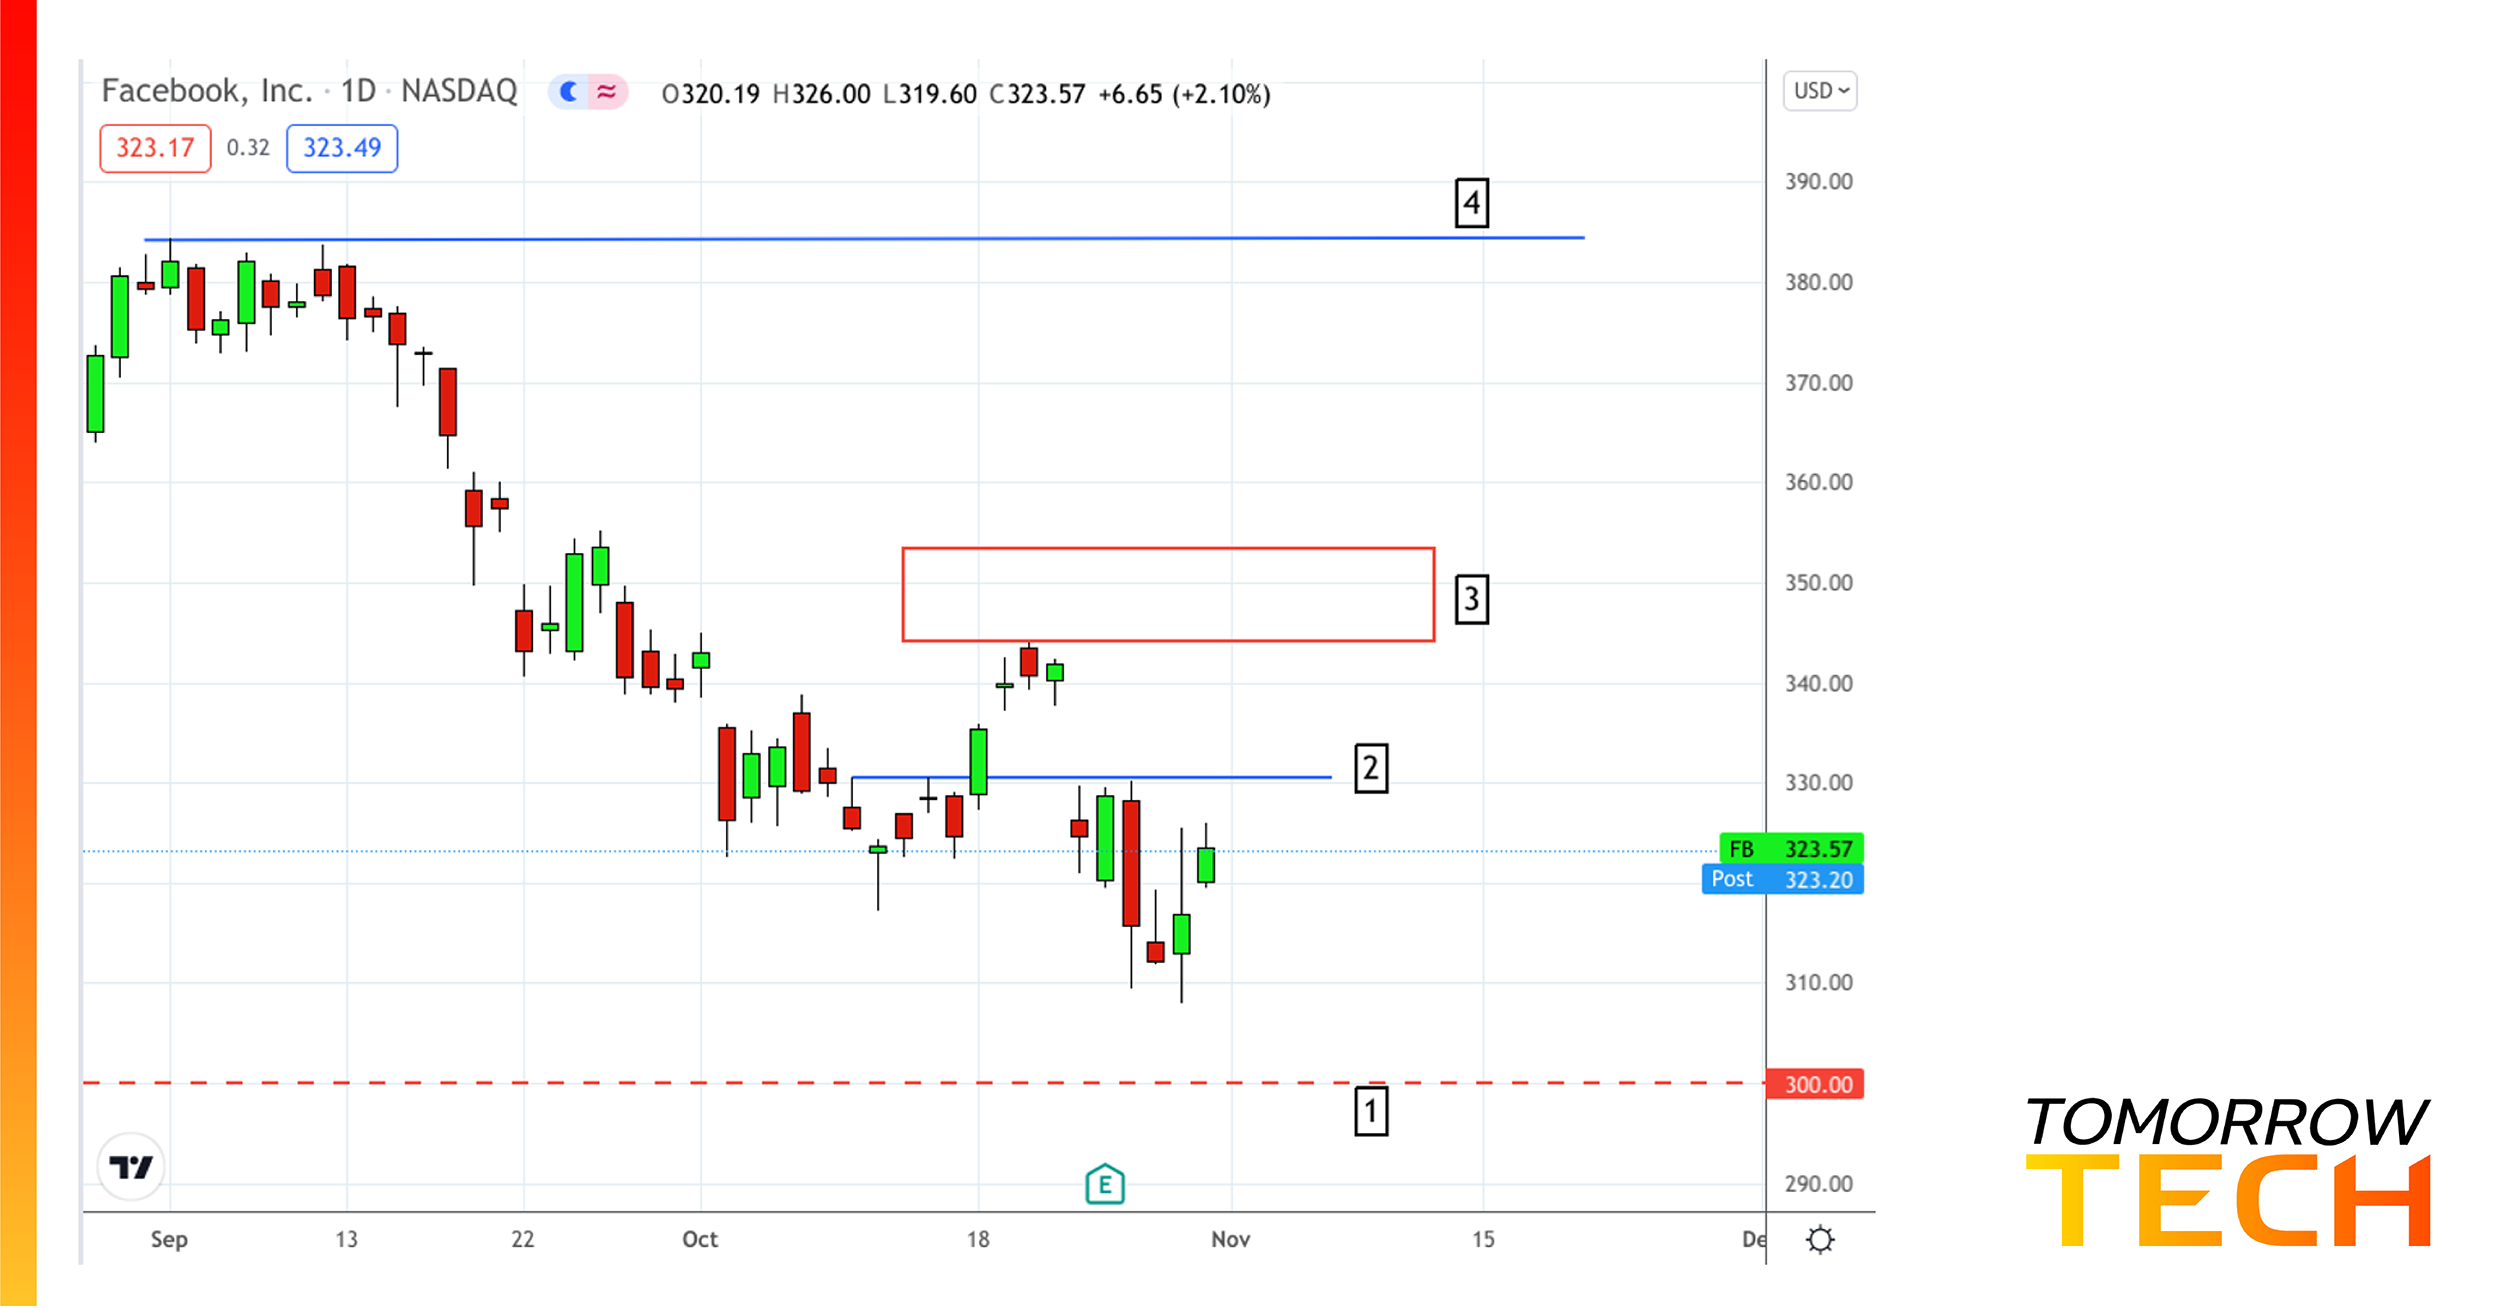
There are many, but be sure to note the following levels.
- Don’t be surprised if shares sink to $300 at [1]. Not only is it an even number, but it was also a breakout level in March and a support level in April and May. Plus, it sits right below the 61.8% Fib level from the January low to the September high.
- Gaps tend to get retested. For that to happen, watch out for resistance at $330.20 shown at [2].
- Potential resistance (or short-term profit target) lay near [3] at the $350 range. It marks the 61.8% retracement from the September high to the current low.
- But if it does break toward that level, and if you are short, watch out for $310 (or $300); a failure to break down upon retest indicates a potential upside reversal.
- For long-term holders, a break above [4] not only establishes an all-time high but a resumption of the uptrend.