
September fulfilled its seasonally negative expectations, but what are we to expect in October? September tends to be bad for stocks, but October fears may be blown out of proportion.
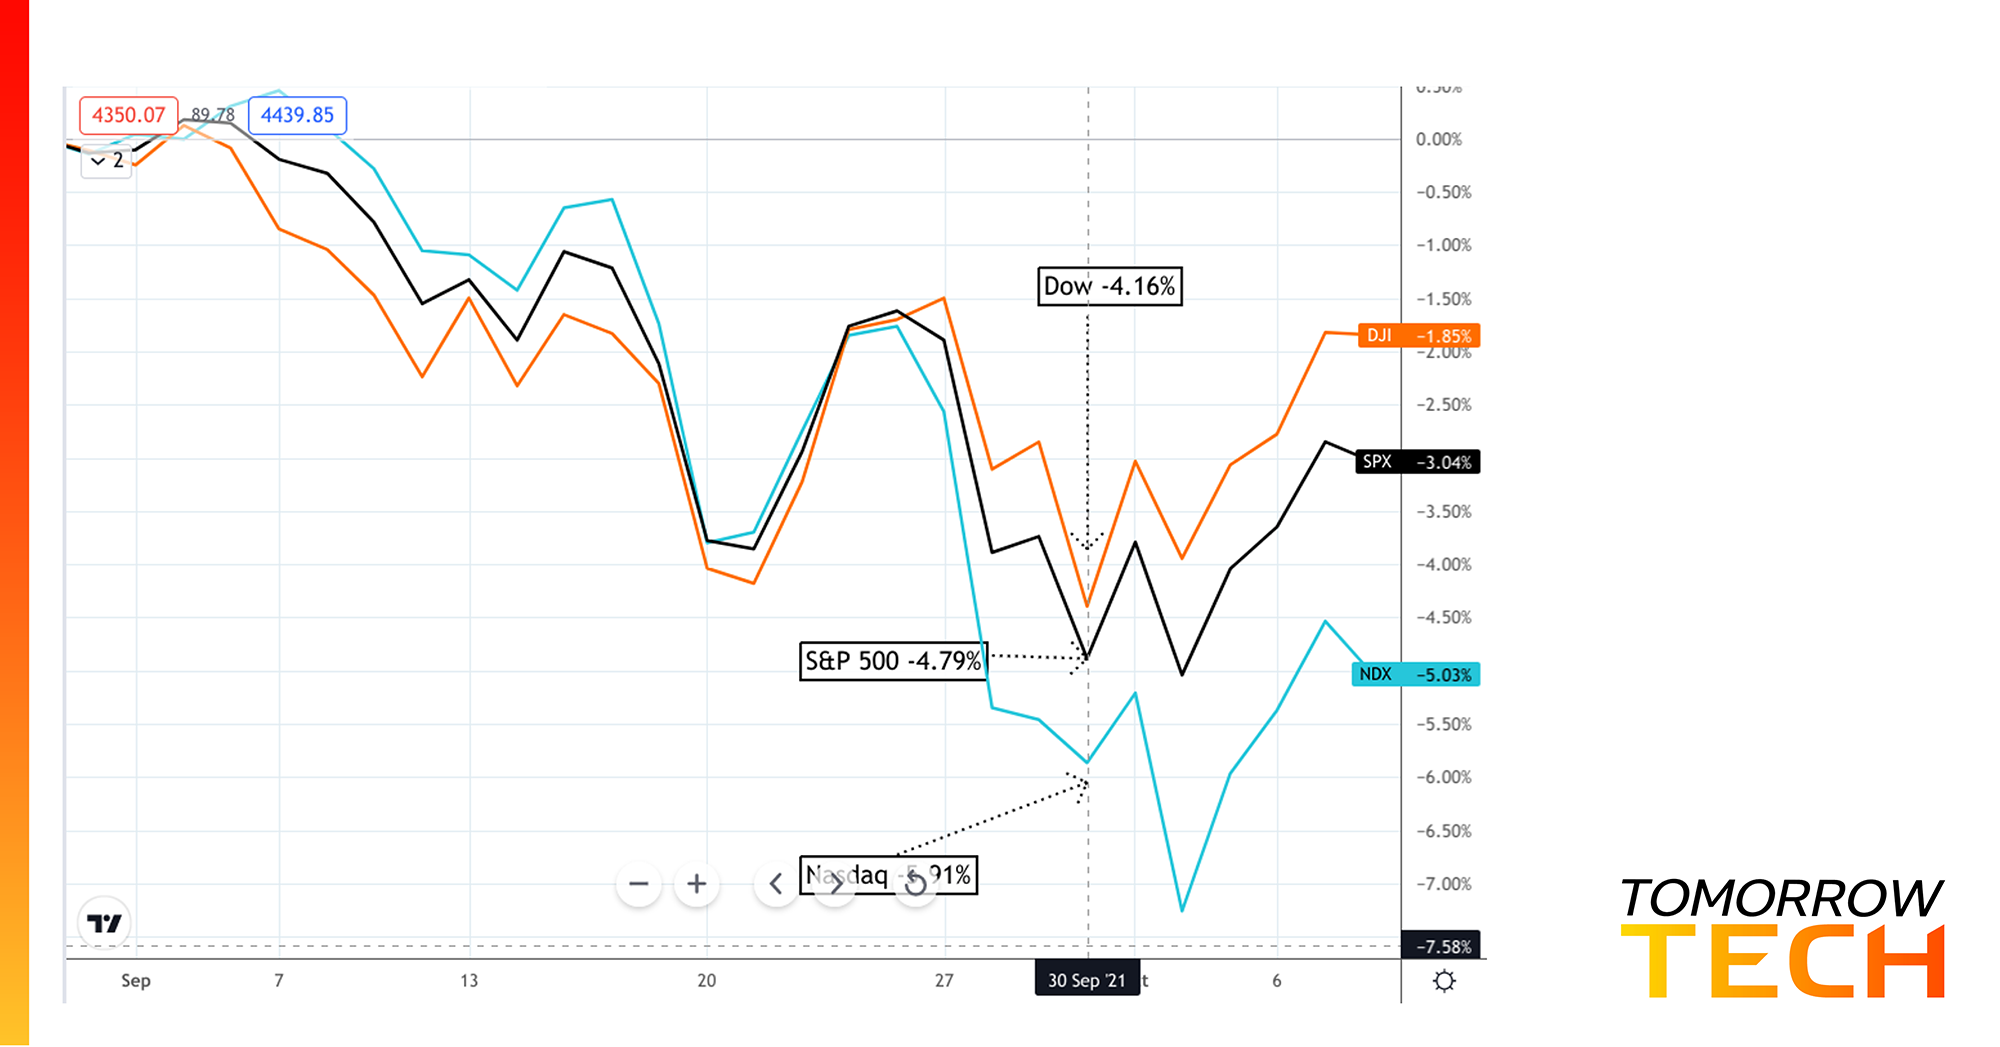
Investors expecting the worst of the seasonally-dismal September pretty much got what they were anticipating, at least in the US markets. The S&P 500 index dropped 4.79%. Although many investors fear the October Effect’s downward pull, it might be a relief to learn that seasonal data historically disagrees with it—rendering the October Effect a mere myth.
Overall, the broader US market tends to chug along in October, no matter how small the average gain or how volatile the drunken walk is. Of course, there are always exceptions.
US jobs numbers were very disappointing.
Economists expected around 500,000 new jobs added to the US economy in September, and they got less than half that number, precisely 194,000.
So, what might that indicate?
We’re still experiencing pandemic slowdowns. Childcare for working parents is still a big issue, and extra unemployment benefits may be keeping workers at home. Although the Delta variant hasn’t shuttered any businesses, business remains slow.
Perhaps many unemployed workers are having a change of heart about their pre-pandemic work lifestyle. Some may be looking to start their own businesses, and others may be seeking higher pay or a work environment that offers a better work/life balance.
Main point: “Back to work” means opening the supply chain. Until then (and we’re certainly not seeing it now), the US Federal Reserve might not feel comfortable tapering its stimulus.
Economic News Watch
US job openings will be reported Tuesday. Again, job openings won’t mean much unless the positions are getting filled (which they haven’t been for months). September inflation reports are coming in the middle of the week with the US CPI and PPI. Australia’s most significant economic report comes on Wednesday with its September employment change data. And US retail sales end the week to give us some perspective on consumer demand amid rising costs.
An Obvious Head & Shoulders in Energies Confirms Bullish Reversal
The Energy sector has been the big laggard since 2018. Although things took a change in early 2021, the second event to confirm its continued reversal toward the upside happened between July and September with a big Head & Shoulders Bottom.
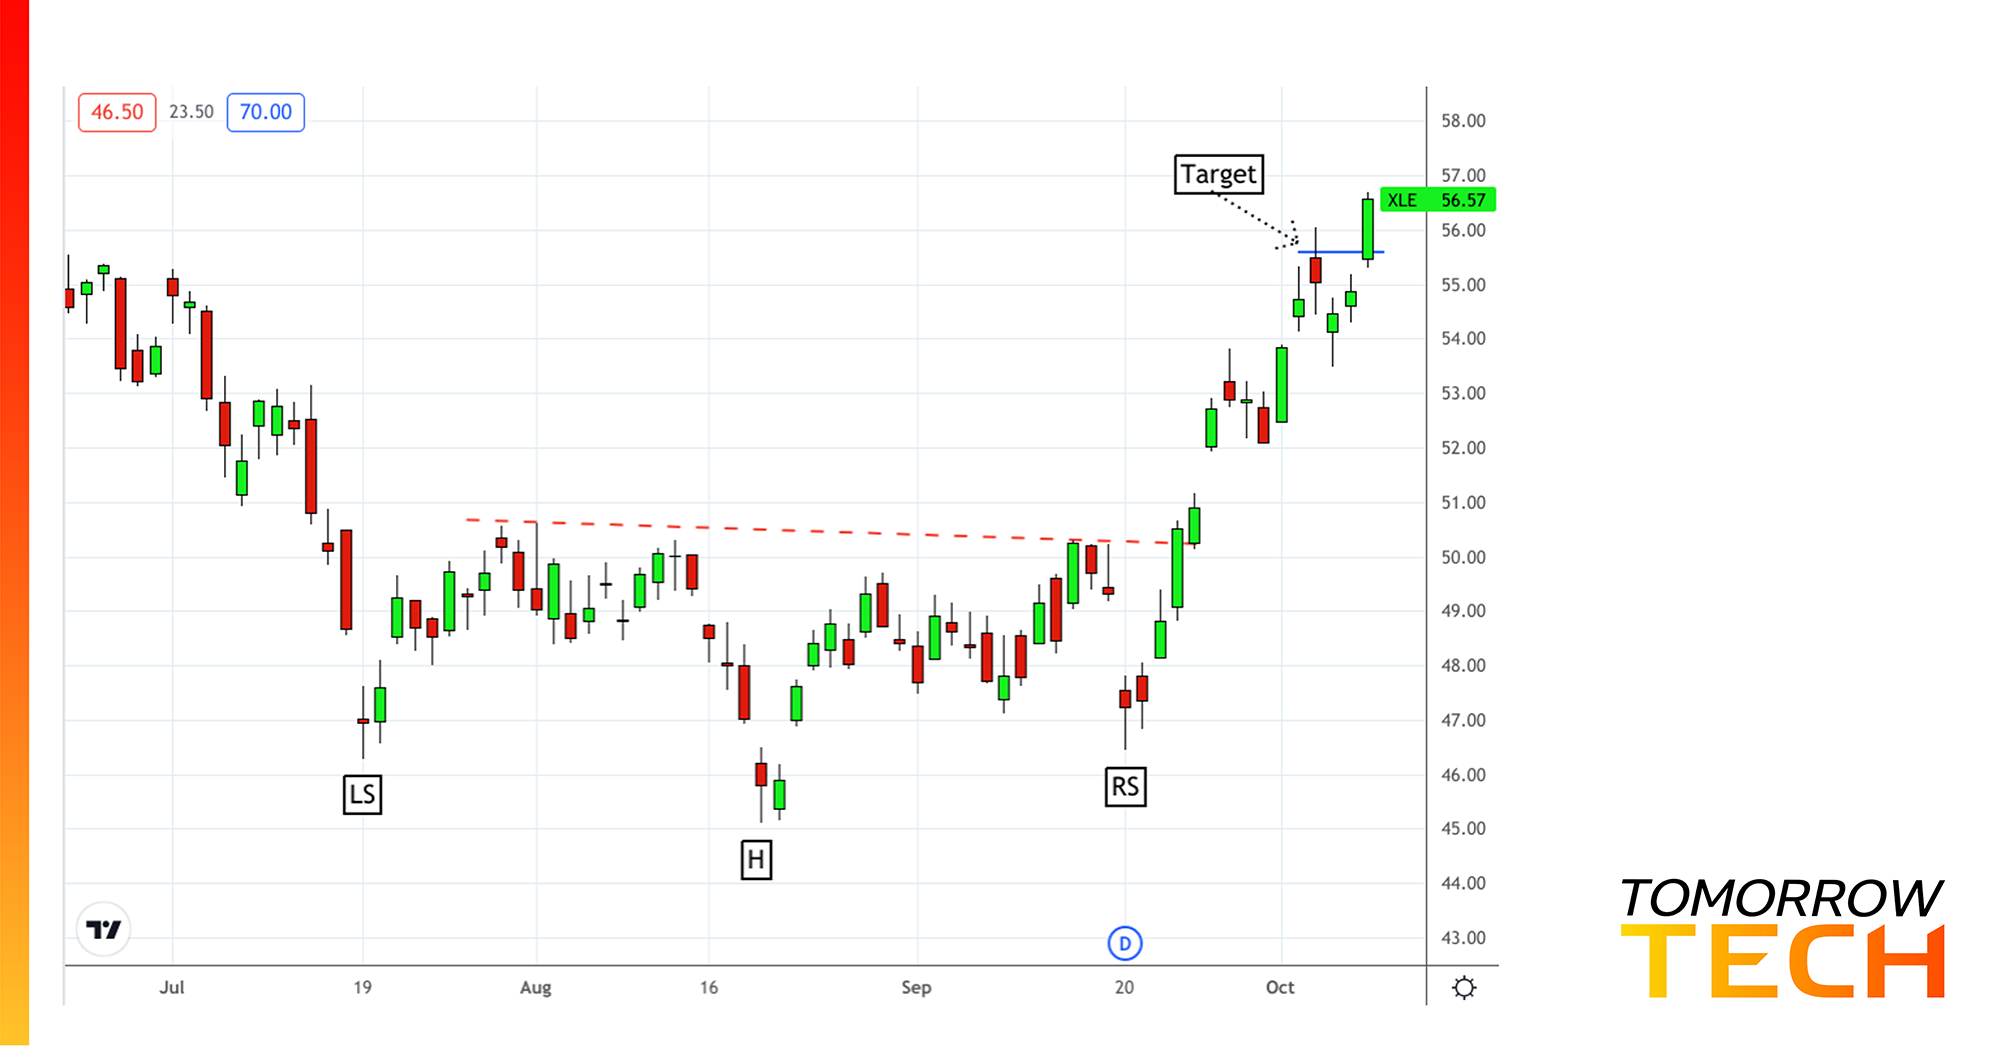
You can see the lower shoulder (LS), head (H), and right shoulder (RS) spanning two months. For those who sought a quick swing trade, calculating the height of the formation from 50.49 (top) to 45.14 (bottom) would have yielded a 5.35 range. Adding that to the breakout point at 50.25 would have produced a 100% measure rule target of 55.60, which was reached at the beginning of October. Note that traditional chart pattern rules don’t always pan out. But in this case, it did, and the trade setup was as evident as could be.