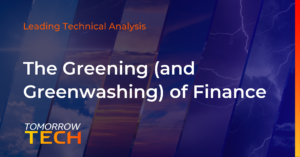
The broader market advances in response to news that the Federal Reserve’s $120 billion monthly bond purchases printing presses are likely to end this year. Did you see the market action following Fed chair Jay Powell’s opening speech at the Jackson Hole conference?
Dow futures (YM) shot up toward weekly highs and stayed there for the rest of the session.
The S&P 500 futures (ES)blasted into all-time high territory.
The Nasdaq futures (NQ) did the same, outperforming the ES for the week.
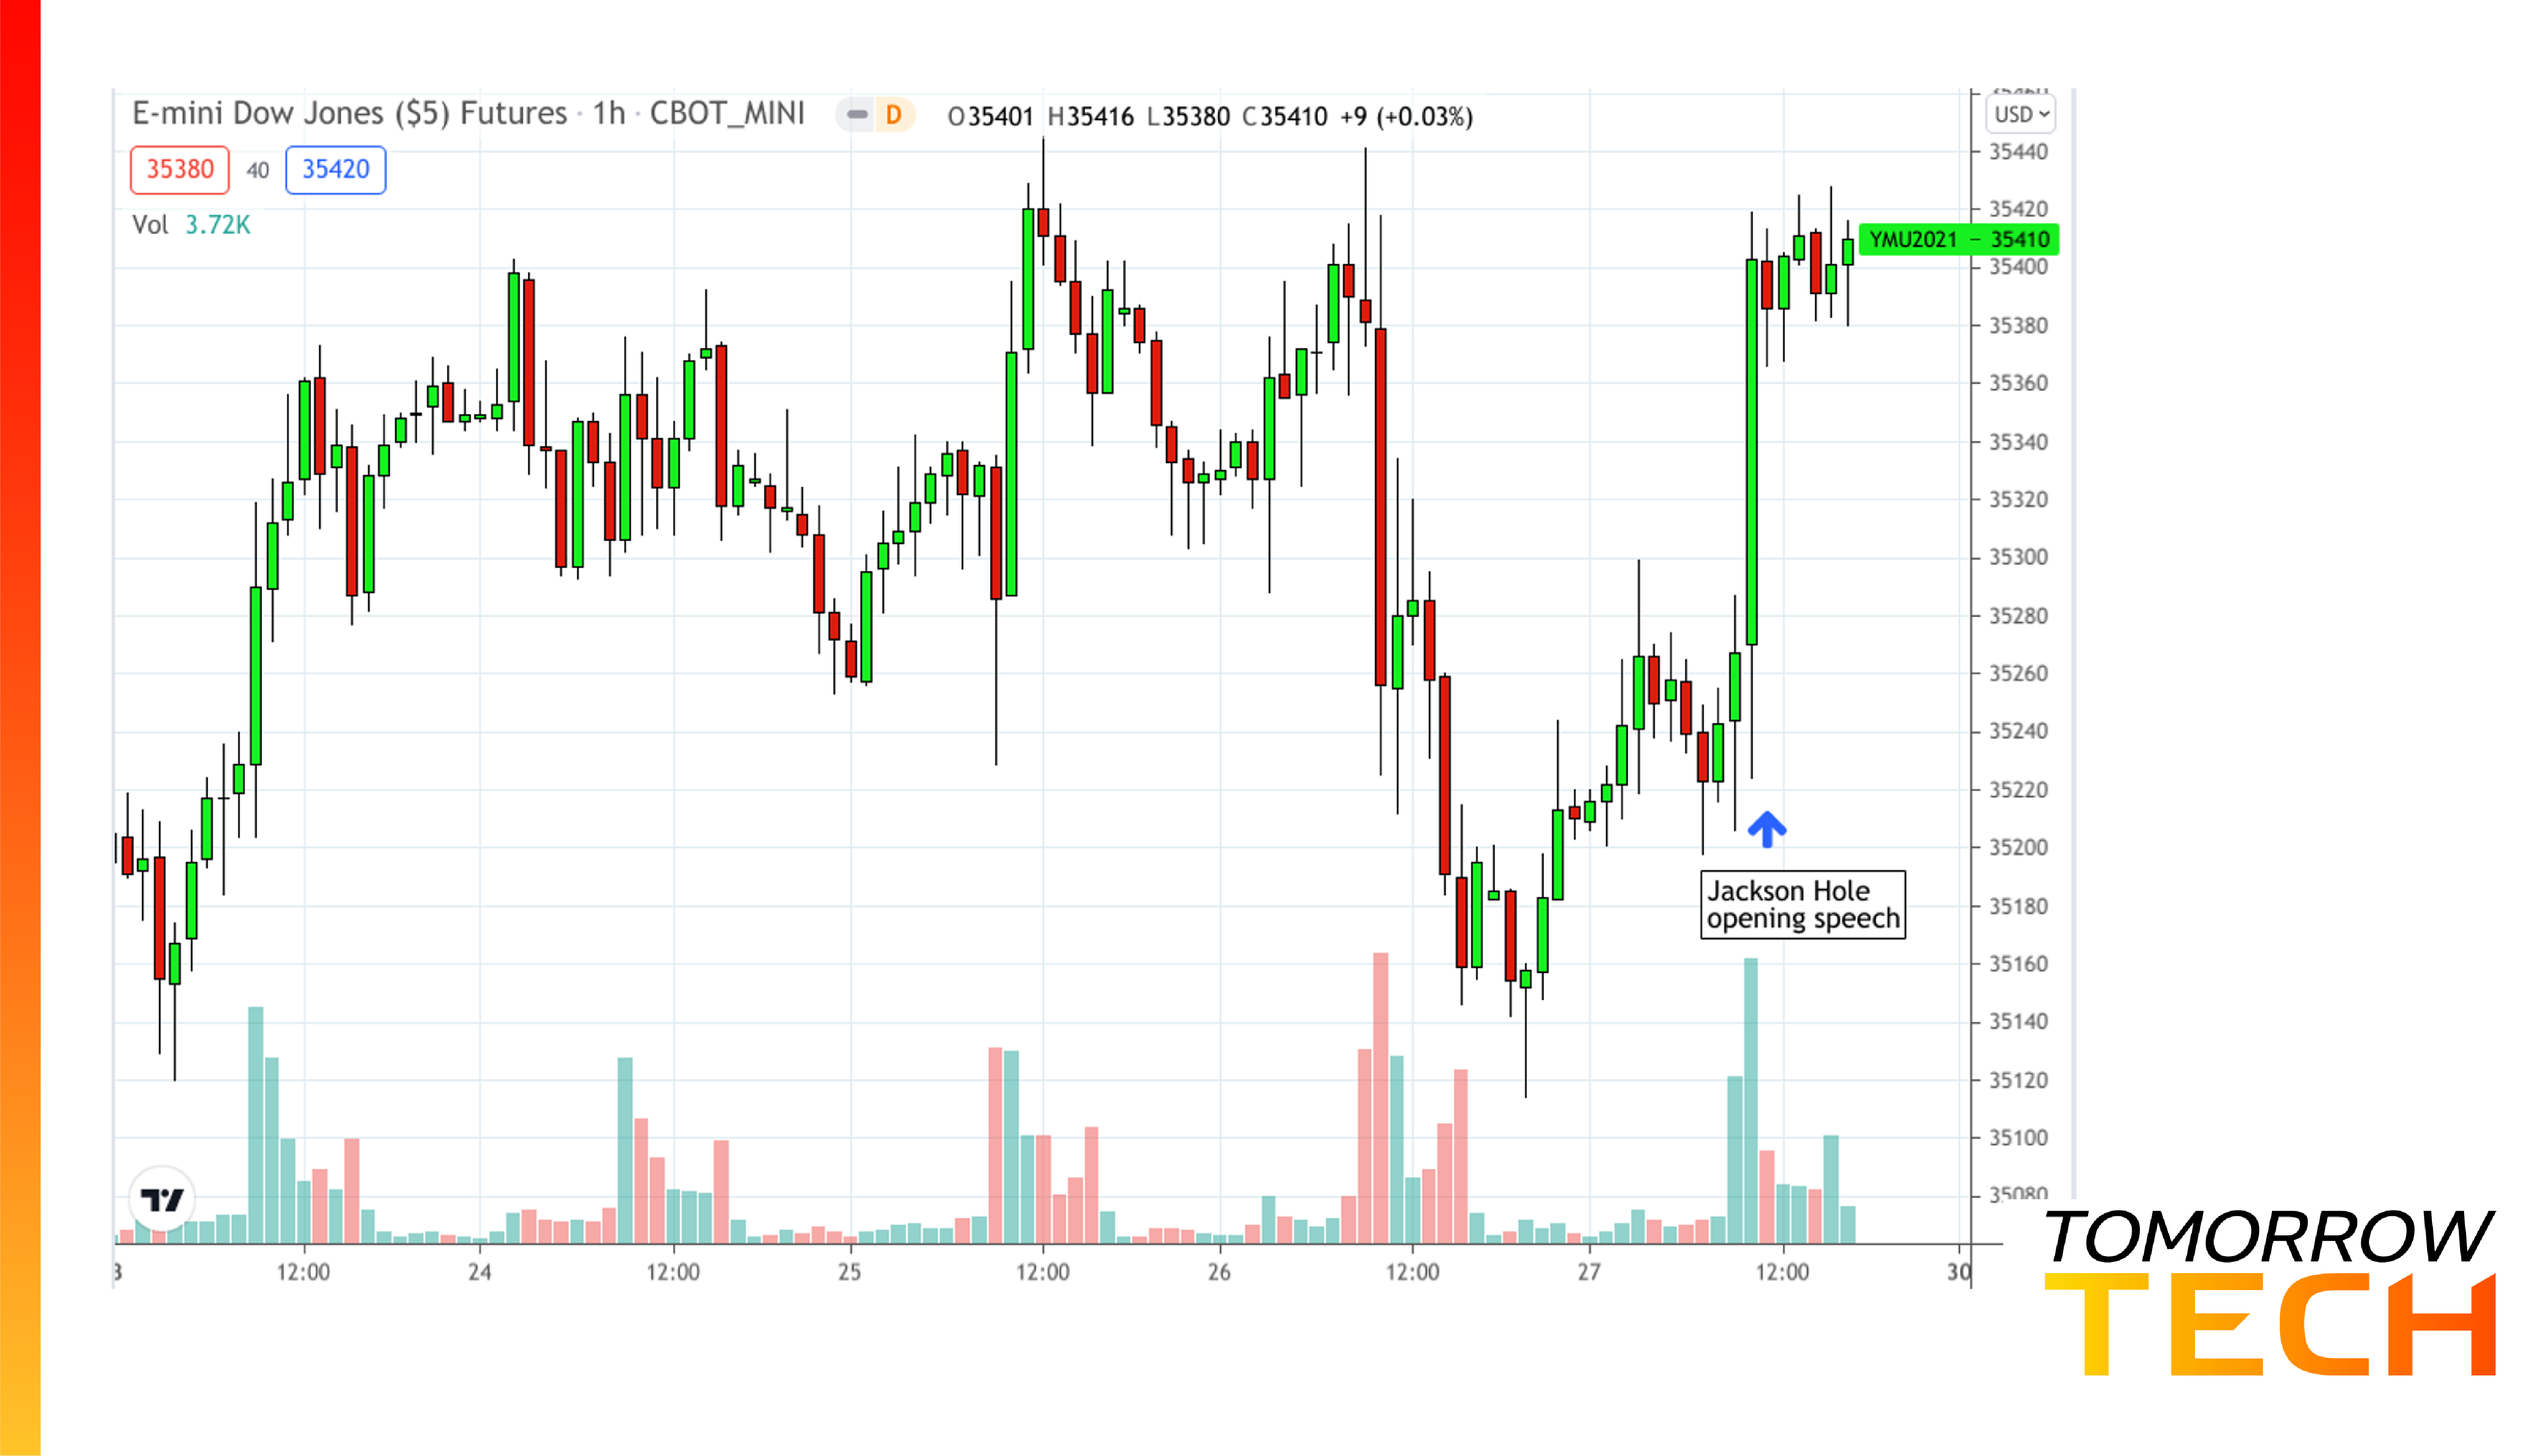
And the “small guys”—aka the Russell 2000 futures (RTY)—though not quite reaching the all-time upper threshold yet, demonstrated an impressive level of strength.
The irony in all of this is that markets typically hate uncertainty, yet, it’s the reason why most people trade the markets—to exploit the advantages that uncertainty has to offer (aka speculation). Uncertainty is far from unusual in the markets. And the idea of investors actively engaging yet dreading uncertainty is kind of like that person in a restaurant eating a way-too-spicy dish—can’t handle the spice yet too good to put down.
At any rate, the Fed’s Jerome Powell finally announced that the monetary “printing presses”—the monthly $120 billion in Treasury bond purchases—are shutting down this year. The exact timing and amount have yet to be decided and announced. The Fed’s apparently satisfied with the rate of inflation hovering around their 2% average target, and while “maximum employment” is still far from being achieved, Powell noted significant progress in that area.
Remember, though Fed tapering is known to have caused “tantrums” in the market, tapering can also be a good sign. After all, the Fed won’t taper unless they see enough economic strength to justify it.
Meanwhile, a key inflation gauge, the core personal consumption expenditure price index, skyrocketed 3.6% year over year, making it the highest reading since May 1991. That may not be “crazy hot”, but it’s still too hot nevertheless, according to some analysts.
Here’s a technical caveat to watch out for: it’s been over 200 days since the S&P 500 Index had a drop of 5% or more. Is that a good sign? Although the past doesn’t always determine the future, historical research does show that when streaks surpass 200 days with no significant drops (think 2018 and 2015), then either short-term gains on the S&P 500 are limited, or a drop is bound to happen. So, it’s kind of a bearish indicator.
Economic News Watch
A whole slew of inflation, employment, and sentiment data is upon us next week. Every event below is potentially market-moving. Australia’s GDP and retail sales come into focus. The Eurozone’s consumer price index is perhaps the biggest set of data to come in next week. And for the US, it’s pretty much all over the map. With the US monetary tapering question now somewhat answered, we can assume that the markets might not be as sensitive to each report as it would have been had the Fed not mentioned anything about tapering at all. Still, volatility is to be expected nevertheless—too many big reports not to rock the global economic boat.
A Water Balloon Burst or a Legit Breakout?
It’s strange to wonder if water futures might be “ballooning” as most traders probably aren’t even aware that such a financial instrument exists. But it does exist; it appropriately goes under the symbol H2O, ironically isn’t very “liquid,” and it’s based on the Nasdaq Veles California Water Index futures. If you’ve never heard of the index before, then either you don’t work in the water industry (that’s most of us, by the way), or you’re not hardcore enough of an environmentalist. Either way, here it is.
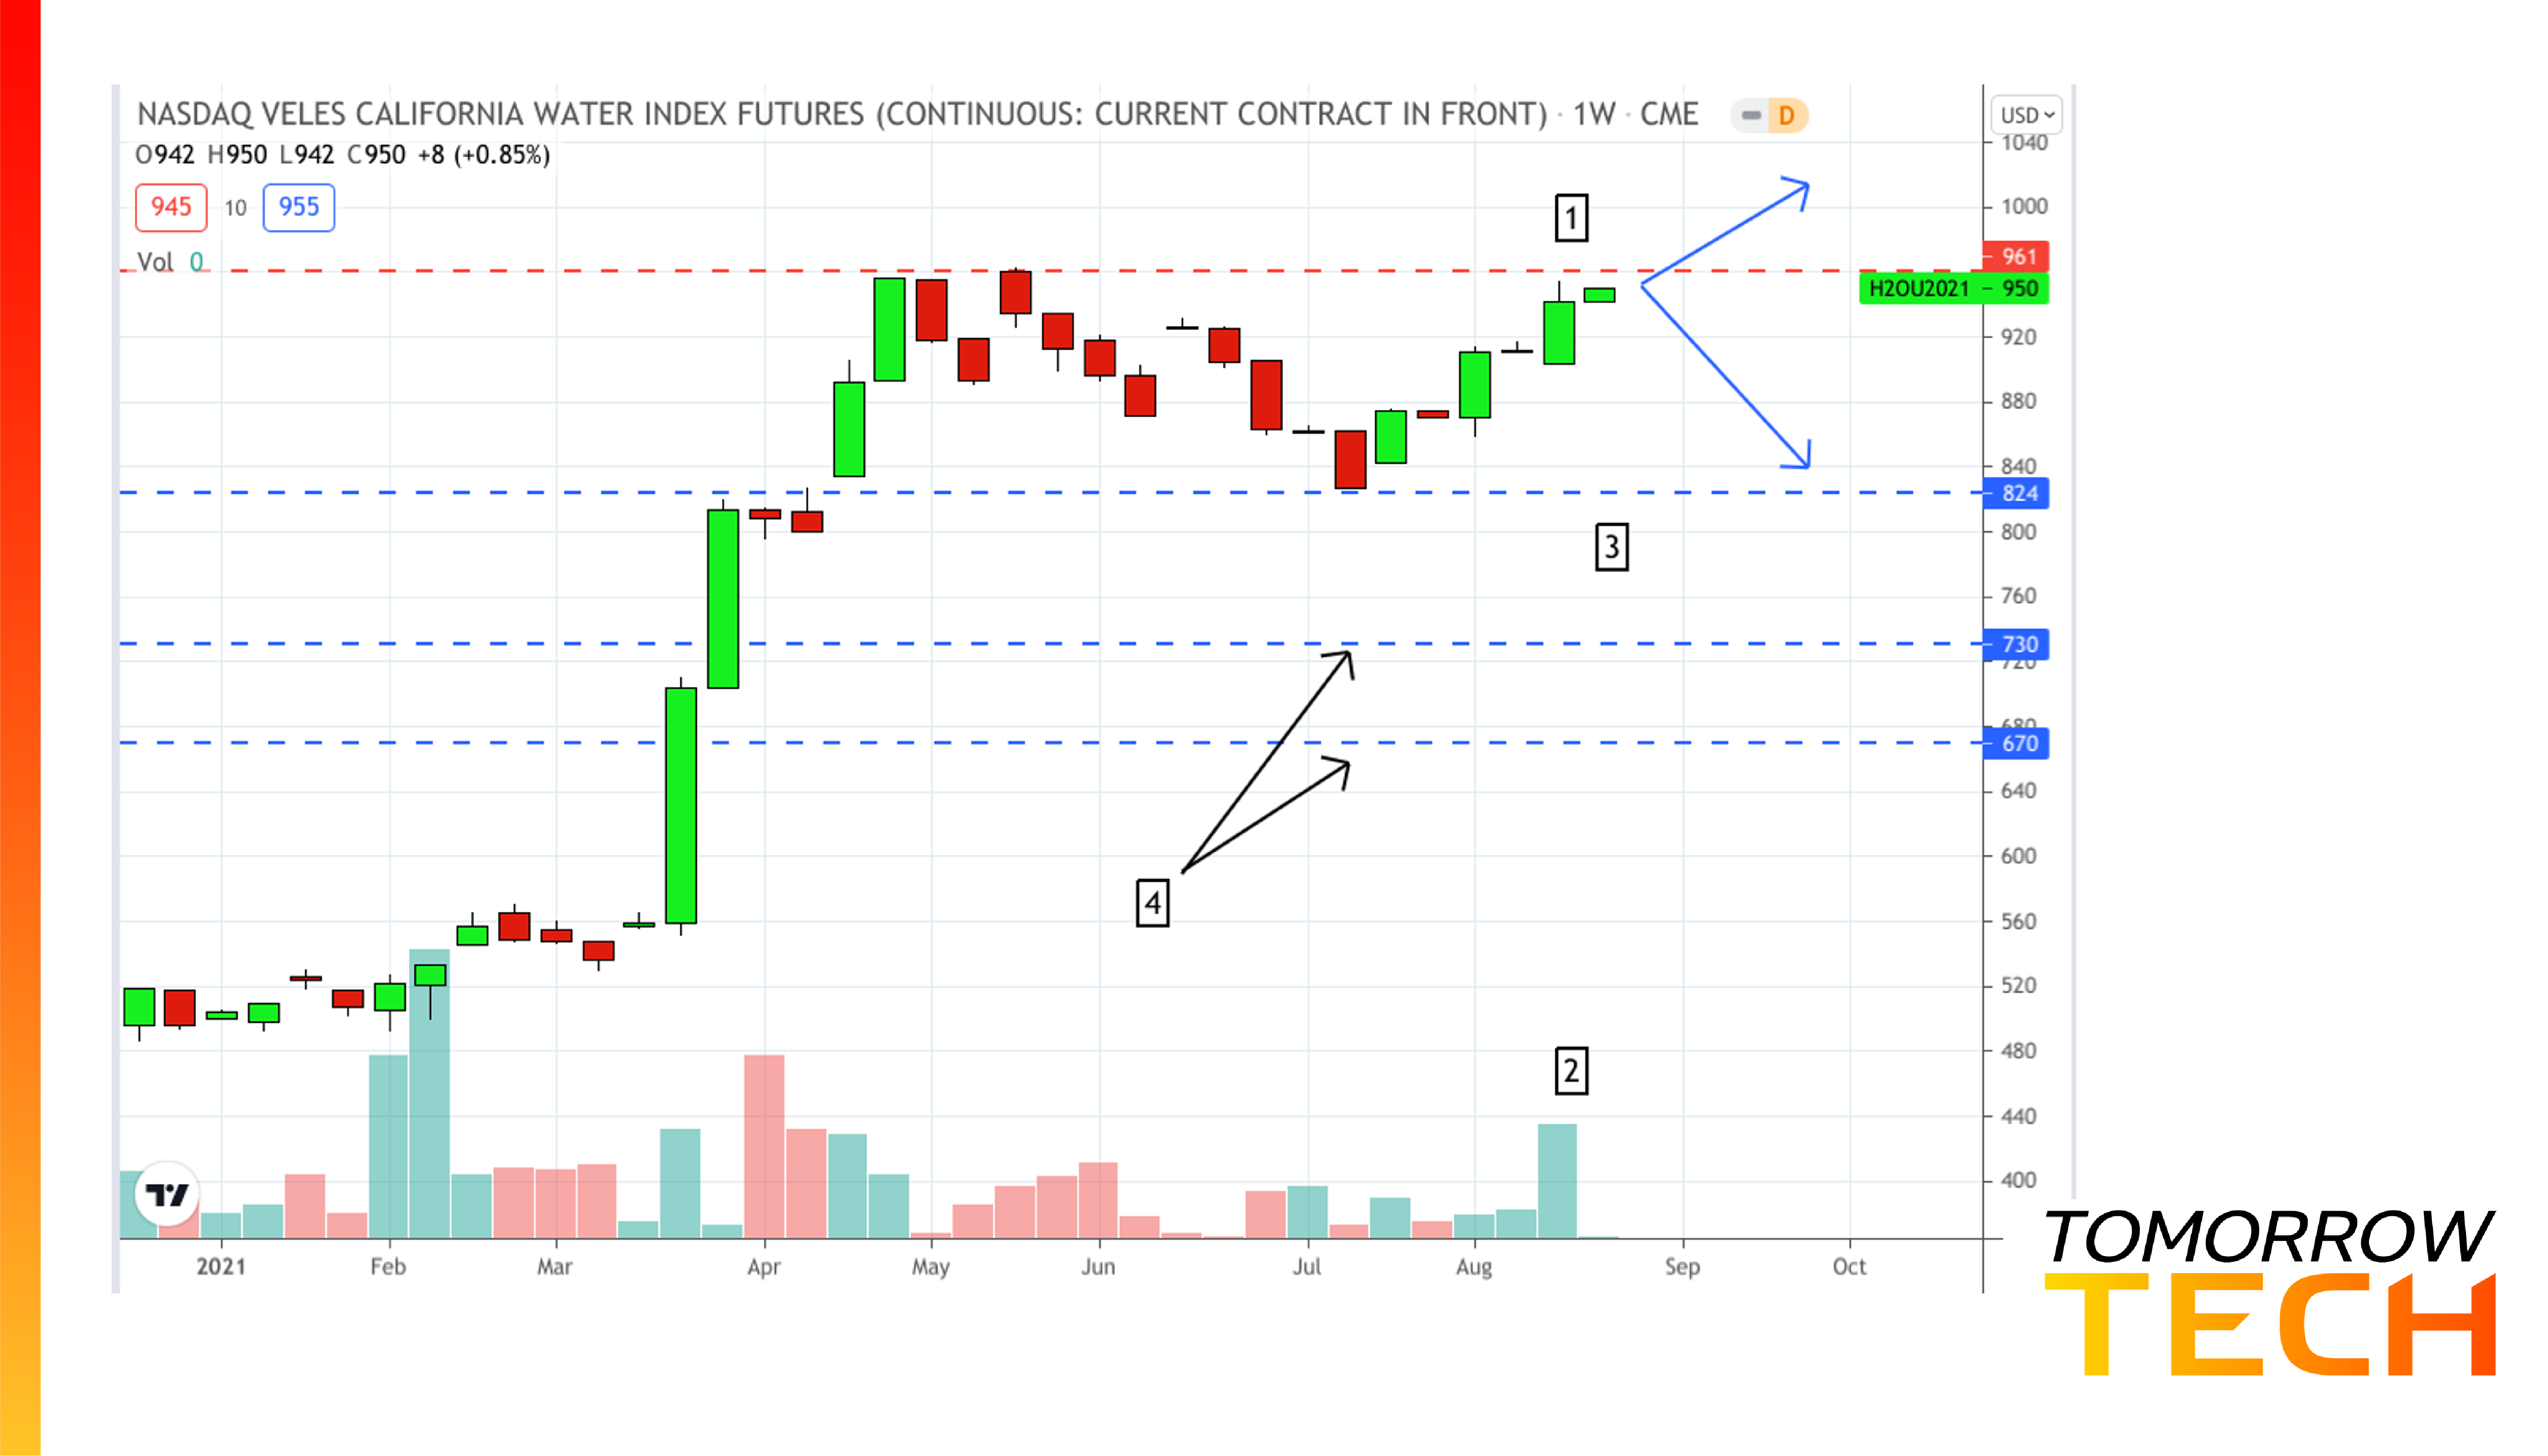
The weekly chart shows that the H2O may be poised for a breakout [1] above the price level of 962. Look at last week’s volume surge supporting this thesis [2]. Of course, the whole thing can just spill, but it has three potential floors, with the first at 827, as shown at [3] offering the most slippery scenario. At this level, H2O can end up in a sideways range unless it gathers enough steam to push forward. And if the price action rhythms match past beats, we’re looking at a potential 5 to 10-week slide (that’s IF such a technical thesis actualizes). If H2O falls below this level, then we’re looking at the price levels of 730 and 670; the 50% and 61.8% Fib retracement (respectively).
You could expect buyers to jump in within that range unless something fundamentally significant changes the forecast. But it looks unlikely. The 2021 Farmers Almanac forecasts “Winter will be cooler and drier than normal, with below-normal mountain snows” in the western states. Plus, it’s fire season, and lots of dry brush spread across a landscape undergoing severe drought. So the question is: do we have enough water to go around? If not, how much higher might the price of water go?

