
Leading technical analysis for tomorrow’s opportunity
To listen to this report, click play ...
Economic News Watch
With the continued threat of the global COVID-19 epidemic, which experts now believe will last for the remainder of 2020, the US economy has continued to produce a mixed bag of results depending on the area being studied.
The market sentiment for the US Dollar, the US Indices and the Commodities; Gold and Oils remains bullish. The coming week will produce figures for manufacturing results for various economies as well as the US and EU monetary policies. Any changes are not expected to be unusually volatile in any way.
Technical Analysis
U.S. Dollar, the new safe-haven currency
To listen to this analysis, click play ...
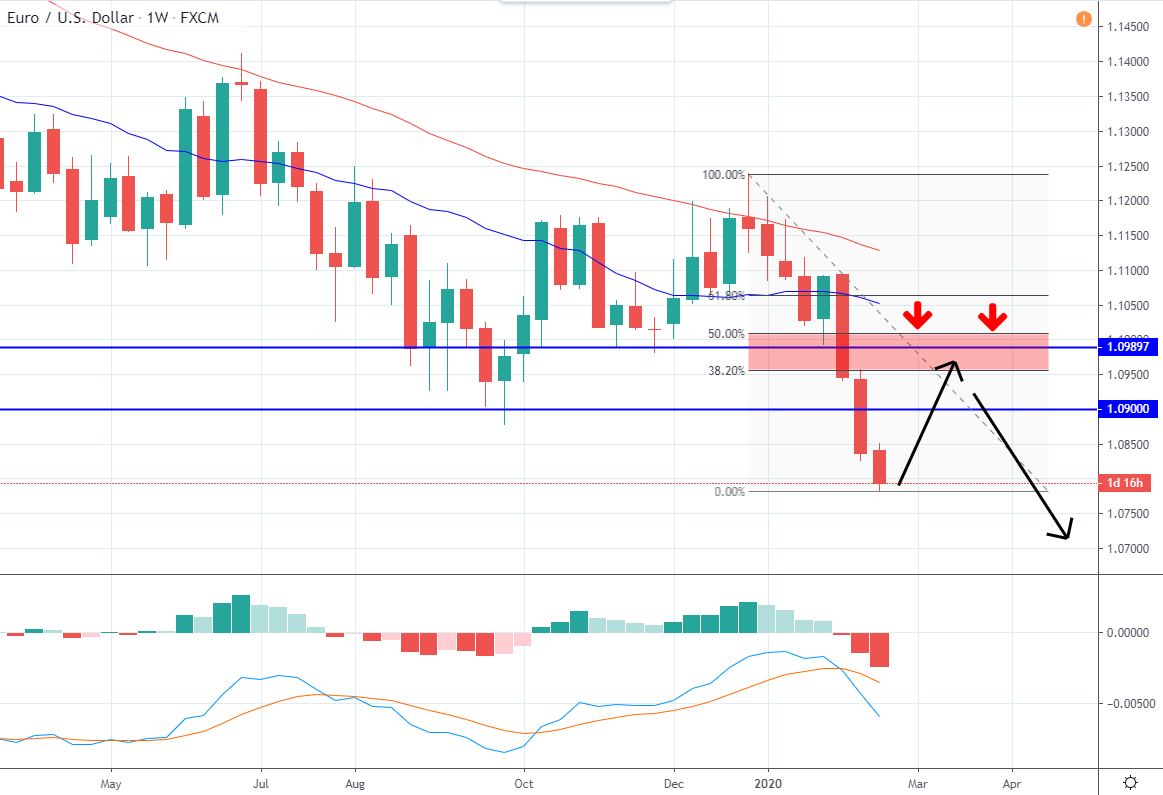
The weekly chart shows a possible impulse to move lower, with the candlesticks closing towards the lows, implying that the sellers are in control.
The MAs here are also in a bearish order, angle and separation.
Price has breached the 1.0800 level recently and is moderately over-extended on this timeframe. A retracement here would make technical sense. Both momentum indicators match the bearish sentiment here as well.
My key price levels have been identified at 1.1000 and 1.0900. Therefore, the potential area price could retrace back into, before resuming the prevailing downtrend, is an area between 1.1000 and 1.0900.
These levels overlap with Fibonacci levels, which should only be measured once the retracement is confirmed with a swing low. Areas with either a 38.2%, 50% and 61.8%, which also correlate with a key price level, could be of additional interest to me.
Ideally, should price retrace into this area and also form a small bearish candlestick against key price levels as well as a Fibonacci level, this could present an economic entry into the trend if it resumes.
ASX 200 to fail at the All Time High?
A brief 60-90 second, HD video on one top market, discussing the technical levels, trend, and potential levels for trading opportunity.
Play Video
We are creative with purpose.